Bitcoin Falls Below $66,000 as Altcoins Test Key Support Levels
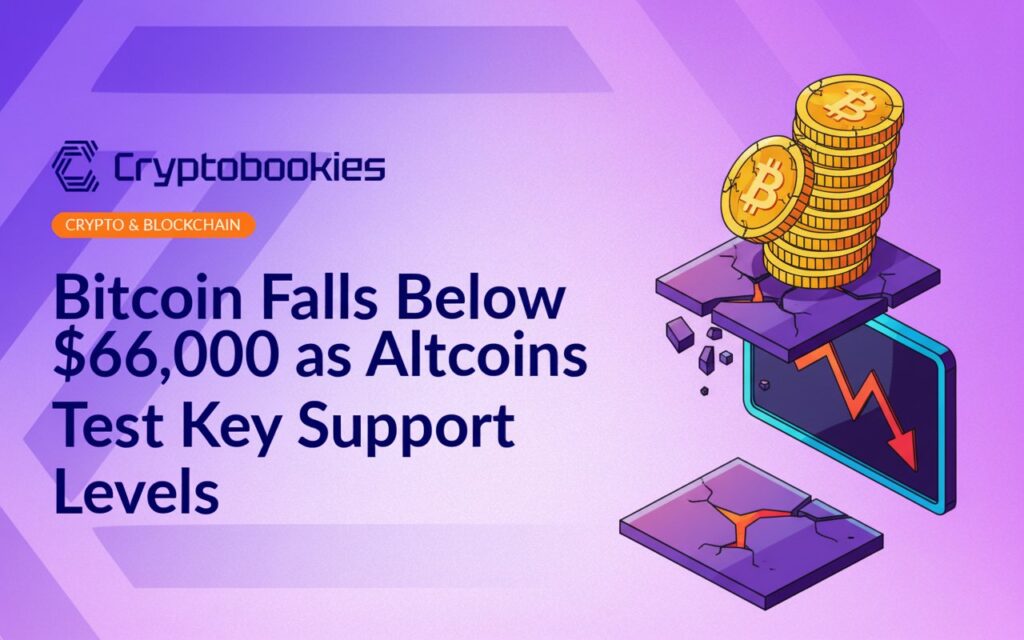
Bitcoin Drops Below $66,000 Support – Major Altcoins Test Key Levels as ETF Outflows Rise
Key Takeaways
- Bitcoin fell below the $66,000 support level, increasing the risk of a move toward $62,500.
- US spot Bitcoin ETFs recorded $171 million in outflows on Thursday, the largest since March 3.
- Several major altcoins, including ETH, XRP, SOL, and DOGE, broke below immediate support levels.
- On-chain data shows a sharp contraction in Bitcoin realized profit, while large holders continued to accumulate.
Bitcoin Breaks Below $66,000 as Selling Pressure Intensifies
Bitcoin traded under renewed pressure on March 27, falling below the $66,000 support level. The move increases the likelihood of a further decline toward the $62,500 to $60,000 range, which has acted as a broader support zone in recent weeks.
Buyers were unable to sustain momentum above $72,000 earlier in the week. After failing to hold that level, the price slipped below the support line of an ascending triangle pattern. A confirmed close beneath that line would invalidate the bullish structure and could accelerate downside movement.
At the same time, geopolitical uncertainty related to the United States and the Israel-Iran conflict has been cited as a factor limiting upside attempts. In parallel, US spot Bitcoin exchange-traded funds saw $171 million in outflows on Thursday. According to Farside Investors data referenced in the source material, this marked the largest daily redemption since $348 million exited on March 3.
Despite the short-term weakness, buyers have defended the $60,000 level since Feb. 6. A break above $72,000 would reopen the path toward $74,508. If that resistance is cleared, the next level highlighted on the chart is $84,000.
On-Chain Data Shows Profit Contraction While Large Holders Accumulate
On-chain metrics point to a significant slowdown in realized profits. Glassnode reported that Bitcoin’s entity-adjusted realized profit has contracted from $3 billion per day in July 2025 to $0.1 billion currently. According to the firm, such compression historically aligns with later stages of bear market conditions.
At the same time, Santiment data shows that wallets holding between 10 and 10,000 BTC increased their combined holdings by 0.45% over the past month. This accumulation by large holders occurred while prices faced selling pressure.
For market participants, the combination of ETF outflows, weakening price structures, and continued whale accumulation presents mixed signals. Short-term flows point to distribution, while longer-term holders appear to be increasing exposure.
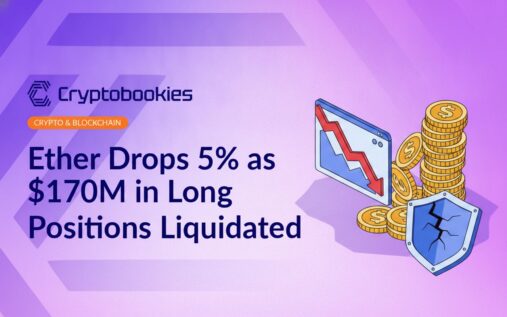
Ether Falls Below $2,111 Breakout Level
Ether dropped back below its recent breakout level of $2,111 and continued lower, slipping under the 50-day simple moving average at $2,044. The next support level on the chart stands at $1,900.
If selling pressure persists, the $1,750 level represents a more substantial support area. On the upside, a decisive move above $2,200 would negate the immediate bearish structure and strengthen the case for a move beyond $2,400.
For users who rely on ETH for transactions across decentralized applications or gaming platforms, these levels define the current trading range and potential volatility zones.
BNB, XRP and SOL Trade Within Defined Ranges
BNB has moved between $570 and $687 for several weeks. Minor support lies at $607, with stronger demand near $570. A breakdown below $570 could expose the $500 level, while a close above $687 would shift focus toward $790.
XRP reversed lower from its moving averages and may test support at $1.32 and $1.27. A break below $1.27 would open the way toward the support line of its broader structure. Conversely, a close above the moving averages would bring $1.61 back into focus as resistance.
Solana failed to hold above the $95 resistance and dropped below its 50-day simple moving average at $86. The asset continues to trade within a $76 to $95 range. A break above $95 could lead to $117, while a close below $76 may expose $67.
These defined ranges are relevant for traders monitoring short-term price stability and liquidity conditions.
Dogecoin, Cardano and Bitcoin Cash Test Critical Support
Dogecoin briefly moved above its moving averages but failed to sustain gains and fell below the $0.09 support. If the price remains under this level, $0.06 becomes the next downside reference. A recovery above the moving averages would bring $0.10 and $0.12 into view.
Cardano turned lower after failing to hold above its 50-day simple moving average at $0.27. Strong support is identified at $0.25. A break below that level could extend losses toward $0.22. A close back above the moving averages would shift the structure toward recovery.
Bitcoin Cash declined below its 20-day exponential moving average at $468 and may test $443 support. A breakdown below $443 would complete a bearish head-and-shoulders pattern, with $375 as the next level on the chart. If $443 holds, the asset could consolidate between that level and the 50-day simple moving average at $491.
Chainlink and Hyperliquid Face Pattern Break Risks
Chainlink reversed from $9.50 and dropped below the support line of an ascending channel. A confirmed close outside the channel could lead to $8.05 and potentially $7.15. If buyers regain control and push the price above $9.50, the upper boundary of the channel becomes relevant again.
Hyperliquid declined from $41.59 and is approaching a support zone between the 20-day exponential moving average at $37.64 and the breakout level at $36.77. Holding above $36.77 would keep the bullish structure intact, with $43.77 as the next resistance and $50 as a higher target. A break below $36.77 would expose the 50-day simple moving average at $33.34.
Our Assessment
Bitcoin’s move below $66,000, combined with notable ETF outflows, marks a shift in short-term momentum across the crypto market. Several major altcoins have broken below immediate support levels or are testing the lower boundaries of established ranges. At the same time, on-chain data shows reduced realized profits and continued accumulation by large Bitcoin holders. The market structure across leading assets currently centers on clearly defined support and resistance levels that will determine whether consolidation continues or downside pressure intensifies.